United’s books for 2025/26 look like a triumph until you break them down. What can Newcastle learn from it.
Manchester United finished third, earned a record £677.6 million and lost £43 million doing it.
The loss came out on Wednesday, inside a results release that led with the record. Chief executive Omar Berrada said the numbers showed a club “on the right trajectory”, and on the operating lines he had a point. Adjusted EBITDA reached £216.4 million, up 18.4 per cent. The club made an operating profit of £22.6 million, against a loss of £18.4 million the year before.
The story lies inside the headline.
The bill for yesterday
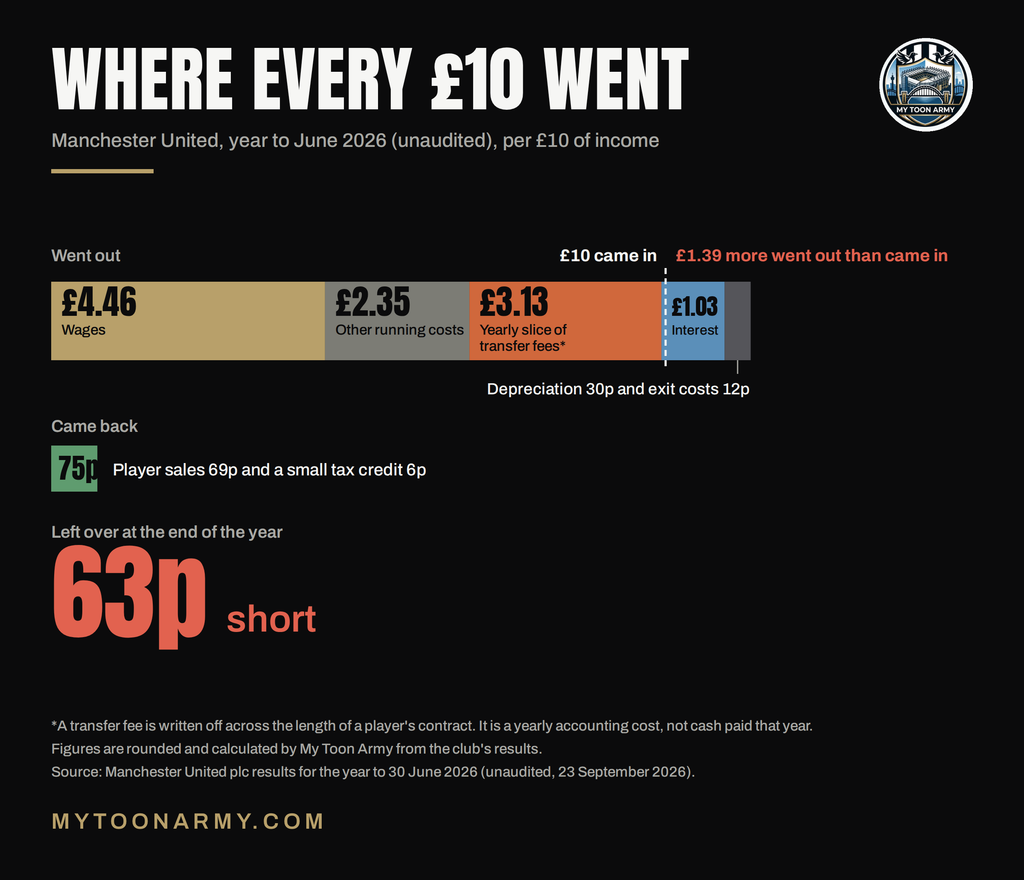
Take a fan’s view of it. Put £10 of United’s income in a drawer and watch where it goes.
£6.81 leaves at once to run the club, £4.46 of it in wages. That leaves £3.19.
Then the past arrives. £3.13 goes on players already in the squad. It isn’t cash out of the door this year. It is the yearly slice of their transfer fees, spread across the length of their contracts, and it lands on the books whether or not a penny changes hands. Just over £1 goes to lenders: £69.6 million in net finance costs across the year, more than the £63.5 million the club spent buying land for a new stadium. Thirty pence covers depreciation on buildings and equipment. Player sales hand back 69p. The last of the restructuring bills take 12p, and a small tax credit gives back 6p.
The drawer ends 63p short.
Some of that interest bill is currency. £10 million was an unrealised loss on dollar-denominated debt, against a gain of nearly £23 million the year before. Strip that out and the underlying interest cost is still higher, by roughly £18 million. In June United also replaced some of its bonds, the notes it sold to investors, with a larger issue that added $125 million to its dollar borrowings.
So the club got better at the parts a fan can see. Third place, Champions League football, a bigger television cheque for finishing twelve places higher. And the same £10 still arrives with claims on it before the head coach sees a penny.
The ceiling
Every supporter has asked why a club doesn’t simply spend more. Moreso when your owner is the richest in the world, like the PIF.
A squad budget is not set by how rich the owner is. It is set by how much the club earns. The Premier League’s squad-cost rules tie what a club can commit to its players, meaning wages, agents’ fees and those yearly slices of transfer fees, to what comes in at the other end. Raise the income and the ceiling rises. Trim the other bills and there is more room beneath it.
United did both this year, in a season without a single European night.
Commercial income came to £317.3 million, and the release announces a training-kit partner in Betway and a sleeve partner in SumUp on top of adidas on the shirt and Snapdragon across the front. The club is selling every square inch of the kit.
The climb from fifteenth to third lifted broadcasting income by £33.9 million, even after the European money vanished. Matchday income held at £153.5 million from just 20 home games, ten fewer than the year before, which the club credits to “strong demand for our general admission and hospitality offerings”. That works out at roughly £7.7 million a home game. Old Trafford holds 74,244 people, and United make them count.
On the other side of the ledger, wages fell 3.6 per cent to £302.0 million, after two years of headcount cuts. The bill for getting there was £36.6 million and then £8.2 million in restructuring, head-coach exits and a pension top-up.
Now the warning label. United expect £740 million to £760 million of revenue next season and £205 million to £225 million of adjusted EBITDA. Subtract one from the other and both ends of the range imply about £535 million of running costs, roughly £74 million more than this year. In the fourth quarter alone, wages already ran at 52.3 per cent of revenue, up from 48.3.
The Champions League money hasn’t arrived, and it has been spent.
What Newcastle should take from it
Every club in the Premier League works under the same arithmetic. So the useful question isn’t what United got wrong. It is which of their moves a club in a different position can copy, and which of their habits it should avoid.
Four things worth copying
Treat league position as income. The climb from fifteenth to third added £33.9 million to United’s broadcasting revenue, and that is after losing their European money. A place in the table needs no new partner and no new stand. For Newcastle, every decision that protects league position, from the depth of the squad to the stability around it, is a financial decision as well as a sporting one.
Sell every surface. United’s commercial income was £317.3 million, 46.8 per cent of their revenue, in a year with no European football and after losing a training-kit sponsor. The club has since filled that space with Betway and added a sleeve partner in SumUp. The lesson is that inventory is a choice: the shirt, the sleeve and the training kit are three sales, not one. For Newcastle the lesson is breadth. The more of the club’s commercial income comes from partners with no link to the owner, the less of it ever faces a fair-market-value question.
Make every seat earn more. The release credits strong demand for hospitality and general admission with holding matchday income up while the number of home games fell by a third. That is yield, not capacity. Old Trafford’s 74,244 seats are about 22,000 more than St James’ Park’s 52,264, so the gap in seats is real. But pricing and hospitality are levers a club can pull before it pours a foundation.
Build in the right order. United finished the Carrington training-ground rebuild in August 2025 and then bought the land for a new stadium. The cheaper, quicker project went first. It is a sequence any club weighing a stadium can borrow.
Five things to fear
Spending money before it lands. United’s guidance shows how fast a Champions League uplift is absorbed by wages. The safer way to treat European income is as a bonus. Where a contract pays more for a European season, the extra should be triggered only when the money arrives.
Interest. More than £1 of every £10 at United goes to lenders, and none of it puts a player on the pitch. When a stadium needs financing, the question for Newcastle is how to keep that cost out of the football budget altogether.
The transfer credit card. Amortisation rose £15.4 million to £211.8 million, and £452.3 million of unamortised fees still sits on the balance sheet. United’s net cash spend on players fell to £143.7 million from £230.0 million, partly by selling future transfer receivables, which brings cash forward and takes it from later years. At June 2025 they owed other clubs £447.1 million in fees. The better measure of a signing is its yearly write-down, not the fee on the headline.
Currency. A £10.0 million loss on dollar debt, after a £22.9 million gain the year before, turned a manageable year into a bigger loss. A club should borrow in the currency it earns.
Slow stadium decisions and churn. United have bought the land for a new ground and the release discloses no cost or funding plan for it. Meanwhile the £44.8 million spent over two years on restructuring and exits shows what changing course costs. For Newcastle, in transition under Matthias Jaissle, the lesson is to settle the big structural questions early, the stadium route above all, and to keep the structure around the team steady while it does.
What happens next
Newcastle’s latest accounts, when they arrive by March year, are the place to test these lessons: are we still on the right path. Until then the ceiling is the fixed point around which every club plans.
The finances of a Big 6 team is quite different from Newcastle’s – how are we charting our own path? Join the conversation on X @mytoonarmy #NUFC
A tweet on X, a five-game sample, and the maths behind a start that’s running well ahead of the performances underneath it — time the rebuild shouldn’t waste.
Twelve of sixteen. That’s how many “big chances” Manchester City’s opponents have missed against them this season — the club sitting top of the Premier League, conceding chances at a rate that would alarm most defensive coordinators, saved from the numbers by finishing so wasteful it borders on charitable. It’s a useful place to start, because the exact same mechanism is sitting underneath the numbers at Newcastle right now — just working in the other direction. That’s not a reason to panic. It’s a reason to be honest about what the next few months are actually buying the club, and what needs to happen while the buying lasts.
The claim
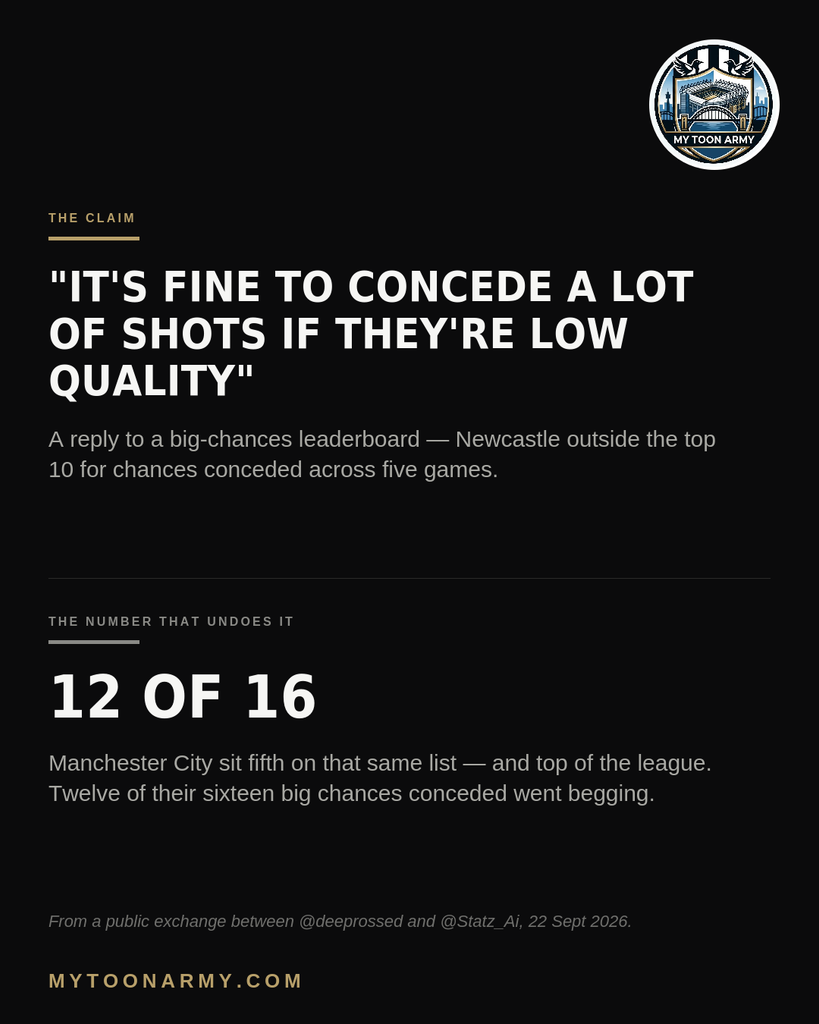
On Monday night, Ross (@deeprossed) replied to a thread from the analytics account Statz (@Statz_Ai) that had ranked Premier League sides by big chances conceded across their first five matches. Newcastle didn’t crack the top ten. Ross’s conclusion: the volume of shots Newcastle are conceding doesn’t matter, because the shots aren’t good ones, and a defence facing low-quality efforts is a defence that’s fine.
It’s a reasonable-sounding instinct — the sort of thing that gets nodded along to by ten thousand people before anyone runs a number on it. It’s also wrong, in a way that’s provable rather than debatable, and it’s worth taking apart properly rather than dismissing with a shrug. Ross clearly cares about the numbers enough to go looking for them, which is more than can be said for most of Twitter. He’s just reached for the wrong one.
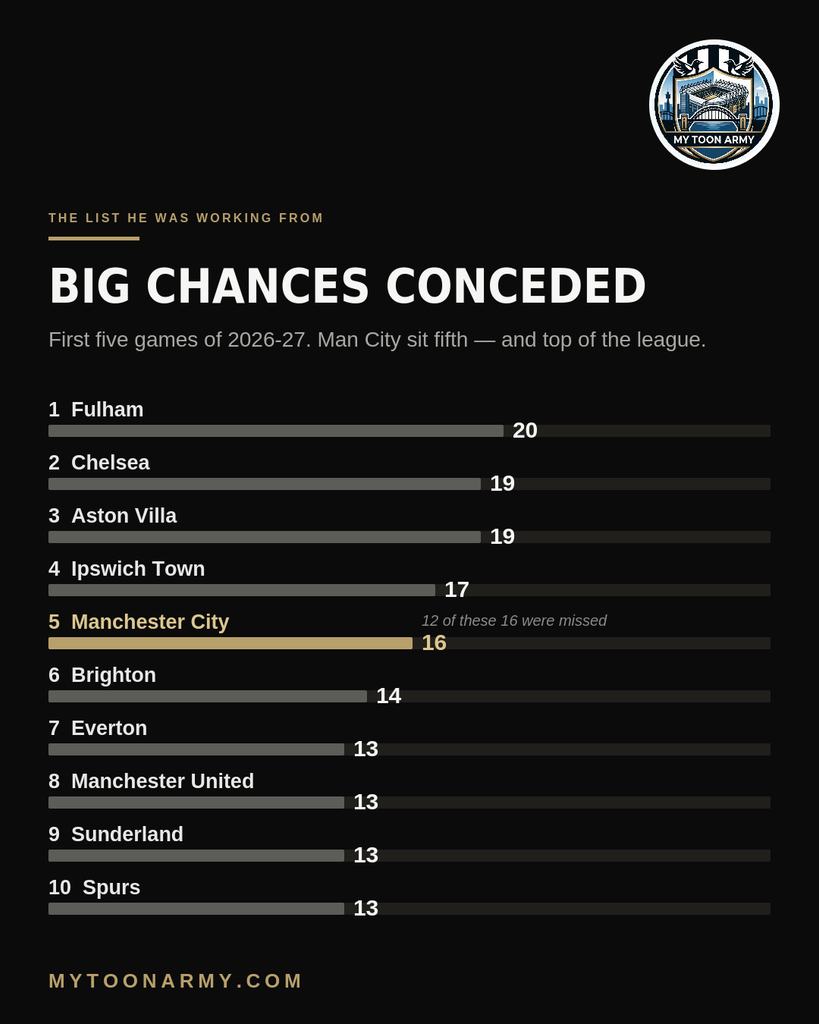
Here’s the leaderboard he was working from:
Two things jump out immediately, and Statz himself flagged the second one in the very next line of his own thread: Manchester City — top of the league, unbeaten, five straight wins — sit fifth on this list, and twelve of the sixteen big chances they’ve conceded have been missed. That’s a 25 per cent conversion rate against opponents in the highest-quality bracket of shot, roughly half what you’d expect a competent Premier League forward line to manage from situations Opta’s own analysts have judged good enough to be expected to score from. City aren’t controlling that outcome. They’re benefiting from it.
Which means the stat Ross is leaning on for reassurance is the same stat currently explaining why the best team in the country isn’t getting punished the way its underlying defending suggests it should be. If it can flatter Manchester City by twelve wayward finishes, it can just as easily flatter anyone sitting further down that list — including a side that isn’t on it at all.
Where “big chance” breaks down
Start with what the category actually measures. A big chance, in Opta’s framework, is a shot from a position where a player would reasonably be expected to score — broadly, the far right tail of shot quality, roughly the efforts carrying something north of a 30–40 per cent chance of going in. It’s a deliberately narrow bucket, built to flag the sitters and the one-on-ones. It was never built to describe the totality of a team’s defensive exposure, and using it that way is the first error in Ross’s reasoning.
Expected goals exists precisely because a binary “big chance or not” filter throws away almost everything that actually happens in a football match. Every shot faced carries some probability of becoming a goal — a cut-back turned first-time from the edge of the box, a corner that falls kindly for a half-hit volley, a defensive header that only half-clears — and none of those routinely qualify as big chances, while each of them carries a real, non-trivial chance of finding the net. A defence can concede zero big chances by Opta’s definition and still be bleeding an expected-goals total north of two a match, purely by accumulating enough of that middle tier. Counting only the tail and drawing conclusions about the whole distribution is the mistake sitting underneath the tweet.
The maths nobody tweets
Treat each shot faced as an independent trial with some probability of success, p, and the probability of conceding at least once across n shots follows: P(at least one goal) = 1 − (1 − p)ⁿ. Shots that fall outside the big-chance bracket still convert at something in the region of one in twelve to one in fourteen — nowhere near zero. Run fifteen of those through the formula at p = 0.07 and the probability of conceding climbs past 65 per cent. Push it to twenty shots and it clears 75 per cent. None of those shots needs to be a big chance for that outcome to arrive. The danger was never sitting in any single effort — it’s compounding across the volume, the same way a casino’s edge does across enough hands, regardless of how unthreatening any individual one looks.
Goals themselves don’t arrive smoothly, either — they arrive as counts, which is where a Poisson model earns its keep. The tool takes its name from Siméon Denis Poisson, the French mathematician who introduced it in an 1837 study of criminal and civil jury verdicts, working out how to predict the number of rare, independent events that would occur within a fixed stretch — given nothing more than their average rate — from a starting point in probability theory rather than sport. It’s since become the standard way to model exactly that kind of count in football: not how likely any single shot is to score, but how many goals a team is likely to concede across ninety minutes given its overall rate of chances allowed. Treat goals conceded in a match as Poisson-distributed with mean λ equal to cumulative expected goals faced, and the relationship between shot volume and disaster is convex, not linear: nudging λ from 1.0 to 2.0 doesn’t just double the expected goals conceded, it disproportionately inflates the probability sitting in the two-and-three-goal outcomes — the collapses, not the routine defeats.
And there’s a reason a five-game count of big chances conceded is such an unreliable guide in the first place. Rare-event counts behave like Poisson processes, and their relative variance — the coefficient of variation — scales with 1 ÷ √λ. A stat averaging one or two events a game wobbles enormously over five matches; a stat averaging twelve to fifteen events a game, like total shots faced, doesn’t. Put a number on it: a defence with a genuine long-run rate of 1.5 big chances conceded per game would, over five matches, have a Poisson mean of 7.5 and a standard deviation of roughly 2.7 — meaning a perfectly average defence could produce anywhere from two to thirteen in this exact sample purely by chance, before a single tactical or personnel factor gets involved. The leaderboard Ross quoted, running from 20 down to single figures inside five fixtures, is a metric demonstrating its own unreliability in real time.
This is also the terrain of PDO — a name that looks like an acronym but isn’t one; it comes from the online handle of a commenter on an old Edmonton Oilers hockey blog who first noticed the pattern it now describes. The stat itself is simple: a team’s save percentage plus its shooting percentage, added together and used as a rough proxy for how much of a team’s results are being carried by finishing variance rather than repeatable process. PDO across a division tends to sit close to a league-average baseline over a full season and drift back toward it wherever it’s strayed. City sitting on a big-chances-conceded record that would normally trouble a mid-table side, while their opponents miss three-quarters of their clearest sights of goal, is a PDO story. Newcastle’s own numbers, below, show exactly where that same dynamic currently sits for them.
Newcastle, by the numbers
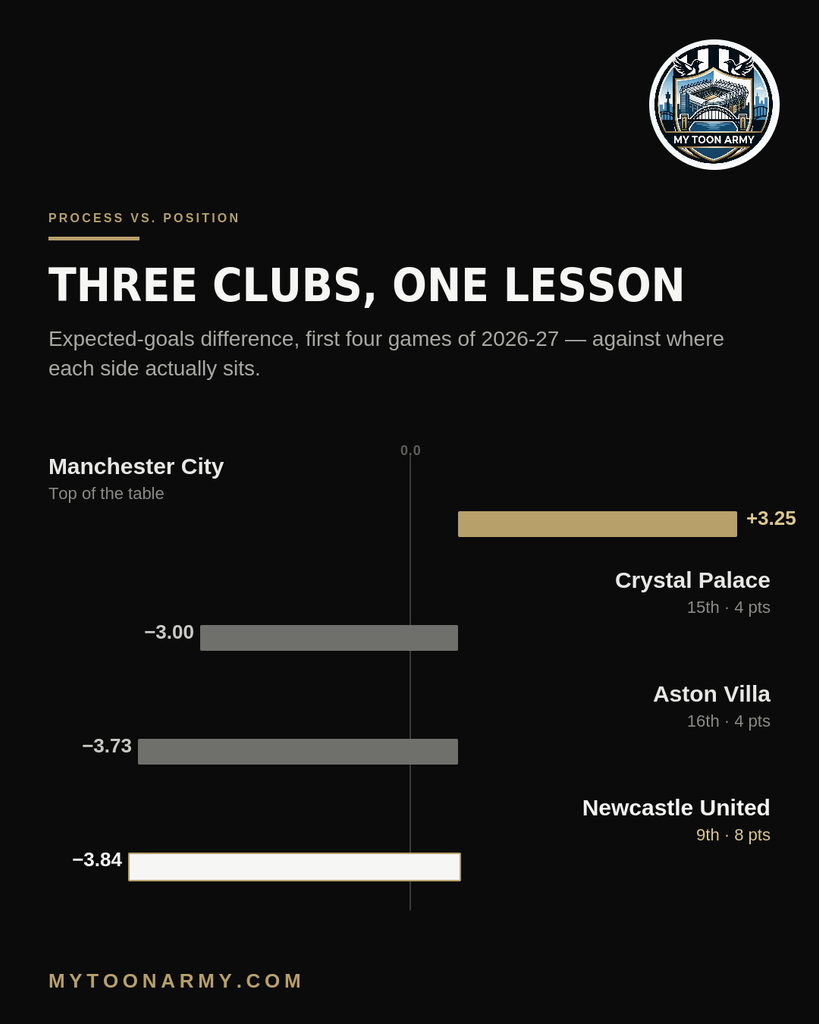
Here’s where the theory stops being abstract. Through the first four gameweeks of 2026-27 — the last point at which Opta’s underlying data has been fully reconciled into the season totals — Newcastle have created 3.54 expected goals. That’s the second-lowest tally of created chances in the entire Premier League, ahead of only Aston Villa. At the other end, they’ve conceded 7.38 — the second-highest in the division, behind only Crystal Palace. Put those together and the expected-goals difference is −3.84. Not bottom-half. Not relegation-form. The single worst expected-goals difference of any club in the Premier League, marginally worse even than bottom-placed Aston Villa’s −3.73.
None of that should land as a surprise dressed up as one. This is a squad four months into a genuine rebuild — Bruno Guimarães, Sandro Tonali and Anthony Gordon all sold across the last two windows, a reshaped spine still learning each other, and Matthias Jaissle only a handful of matches into installing a way of playing that was never going to arrive fully formed by September. A dip in the underlying numbers during a squad and identity change is normal. It’s what the numbers below actually mean that matters.
Run those same four gameweeks through Squawka’s rounded xG model — converting each match’s underlying numbers into the scoreline they actually deserved rather than the one that went on the board — and Newcastle sit 19th, with a record of nought wins, two draws and two defeats. Seven places worse than where they actually stood in the real table at that exact moment. There is no bigger gap between deserved position and actual position anywhere in the division.
The finishing explains the whole of it. Newcastle have scored seven goals from that 3.54 xG — an overperformance of +3.46, the third-highest in the Premier League, behind only Brighton and Chelsea. It’s carrying the entire points tally. And it’s worth being precise about where the gap actually sits, because the instinctive read — a defence riding its luck — isn’t quite what the numbers show. Newcastle’s expected goals against through four games works out to 1.85 a match. Their actual goals conceded, across five completed fixtures as of 20 September, sit at nine — 1.8 a match. The defence isn’t overperforming its process at all. It’s delivering almost exactly what a genuinely leaky process predicts, goal for goal. The only thing standing between Newcastle and a considerably tougher league table is finishing form at the other end of the pitch, and finishing form is, by some distance, the least repeatable metric in the sport — the first thing to regress once a sample grows.
One result already hints at what happens when the wrapping comes off. At Elland Road, Newcastle’s underlying play merited something close to a 2-1 defeat — Leeds’ 1.79 xG against Newcastle’s 0.68 rounds cleanly to that scoreline. The actual result was 4-1. The process was already bad enough to lose comfortably on its own merits; on the day, it lost considerably worse than that.
The very next match, still outside this reconciled four-game window but worth naming on its own terms, put the other half of the argument on the pitch. Hull City had 21 shots at St James’ Park on 19 September — nearly double Newcastle’s own tally of 12, eighteen of them arriving in a second-half siege that had the hosts men behind the ball for long spells. None of that volume amounted to a big chance by Opta’s count; Newcastle actually finished with the better expected-goals total on the day, 1.41 to 1.24, which means Hull’s 21 attempts averaged out to barely a tenth of a goal apiece in quality. Run twenty-one shots at that kind of average probability through the binomial formula above and conceding at least once was odds-on regardless — and Newcastle did, in the 67th minute. What kept the afternoon from unravelling further was two clinical finishes inside the first seven minutes at the other end, and a goalkeeper who made the saves that were there to be made. It’s the whole piece in miniature, inside ninety minutes: a defensive picture that’s genuinely stretched, an attack currently bailing it out, and a final scoreline that gave no hint of either.
FotMob’s own model, running independently of Opta’s and refreshed through that Hull match, tells much the same story from a different angle: an expected-goals-against total of 9.1 across five games — barely different from the nine goals Newcastle have actually conceded — with only two sides in the entire division rated worse defensively. Different provider, same verdict, one gameweek further on.
Three clubs, one lesson
Newcastle aren’t operating in isolation here, and looking at where they sit against two other clubs makes the pattern harder to wave away.
Manchester City’s process matches their position — elite underlying numbers, elite results, with a layer of finishing luck against them sitting on top of genuine quality rather than substituting for it. Crystal Palace and Aston Villa’s processes also match their positions — poor underlying numbers, poor results, the table doing exactly what you’d expect it to do. Newcastle are the anomaly in this set. Their process is worse than Palace’s. It is marginally worse than Villa’s. And yet they sit fifth in this four-club comparison on points while owning the worst underlying number of the lot — which is exactly why the next block of fixtures matters more than the points column currently suggests, and why the work is worth starting now rather than once the table catches up and says so for them.
Tyneside has been here before
None of this is hypothetical for this football club specifically, and it’s worth naming honestly rather than skating past it. In 2011-12, Alan Pardew’s Newcastle finished fifth — an eight-year contract handed out on the strength of it. Buried inside that campaign was a defence recording the worst shots-against totals of Pardew’s tenure, carried by the best save percentage and the kindest finishing luck he ever had at his disposal. None of it repeated. Newcastle spent most of 2012-13 in a real relegation fight, escaping on the second-to-last weekend in 16th.
The lesson from that season isn’t that the collapse was inevitable — it’s that the window bought by good fortune went unused. Pardew’s Newcastle didn’t reinforce the areas the underlying numbers were flagging; a hot finishing spell got mistaken for the finished article, and the rebuild that should have happened during the grace period simply didn’t. That’s the part worth this side getting right instead, and there’s real reason to think the club is better placed to do it: considerably more resource behind the project than Pardew ever had, a sporting director’s office running recruitment with a plan rather than reacting to results, and a manager who is early enough in his own tenure that these numbers are a diagnosis rather than a verdict. History rhyming isn’t the same as history repeating. What happens next depends on what gets done with the time currently being bought — and that part hasn’t been decided yet.
The short version
Facing a lot of shots is dangerous even when hardly any of them are clear-cut, because the risk adds up across the many moderate chances a defence concedes, not just the handful of obvious ones a stats account counts by hand. A ranking built on just five matches of a rare event like “big chances conceded” is too small a sample to trust — it swings wildly by chance alone, which is exactly why Manchester City can sit mid-table on that particular list while topping the real one. Right now, Newcastle’s actual underlying numbers — chances created and chances conceded combined — are the worst in the Premier League, and the only thing keeping the league table from reflecting that is a finishing return in front of goal that ranks among the best in the division — and shooting form is, on the weight of everything football’s underlying numbers show about how it behaves, the least repeatable output in the sport, which makes the current rate far likelier to fall away than to hold.
None of that is cause for alarm, and it shouldn’t be read as one. It’s a side four months into a genuine rebuild, playing for a manager who is still installing his own way of doing things, currently being carried by a finishing spell that’s buying real, usable time. That’s not a small thing — points banked now are points a harder patch later won’t have to find from scratch. The job in front of Jaissle and his staff is simple to state even if it isn’t easy to do: tighten the process producing the shots faced, keep building the chance creation that’s currently running short, and treat the table’s current generosity as working capital rather than proof the job’s already done. Newcastle have lived a version of this story before, under Pardew in 2011-12, and what went wrong wasn’t the lucky start — it was that the club spent the following year finding that out the hard way instead of getting ahead of it while there was still time. That’s the difference that actually matters here, and unlike the stats above, it’s the one still open to being written the right way.
What do you think of our start to the season? Will Jaissle be able to tighten things at the back? Join the conversation on X @mytoonarmy #NUFC
Andoni Iraola spent three seasons building the side he faced at the Vitality Stadium on Sunday, and in the 57th minute Alexander Isak turned in Cody Gakpo’s cross, which had clipped Florian Wirtz on its way through. Liverpool won 1-0. Iraola was Bournemouth’s manager until this summer, and on Sunday he beat them as Liverpool’s. Marco Rose, who replaced him, has three points from five league games.
It was one of nine stories like it. Nine Premier League clubs began 2026-27 under a new manager, the most in an English top-flight season since 1946-47, and change on that scale forces one question: who got it right? Every appointment is judged twice, against the man who left and against the eight who arrived alongside him.
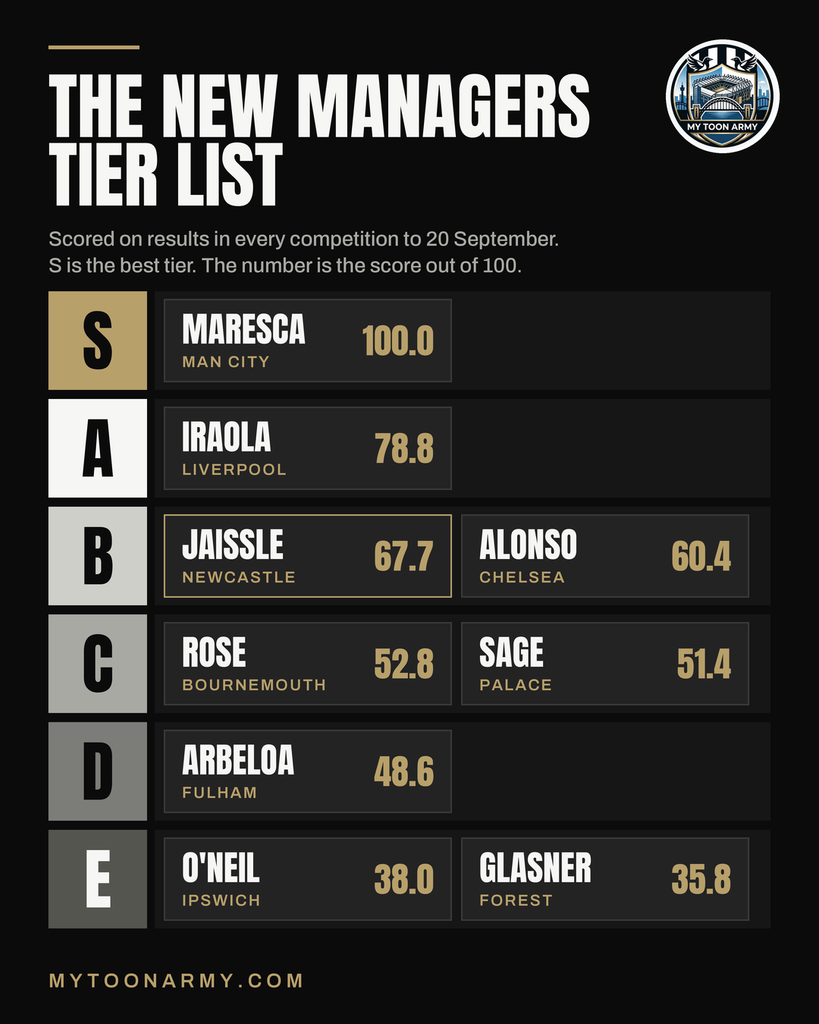
The early answers are already loud. Enzo Maresca has won seven from seven at Manchester City, across the league, Europe and the Carabao Cup. Iraola is the first Liverpool manager unbeaten through his opening five league games since Joe Fagan in 1983. At the City Ground, Oliver Glasner’s side has yet to score at home in the league, and he said on Saturday that he had felt the weight of last season for the first time. Five of the nine have won fewer than half of their games in all competitions.
Loud is not the same as measured. So here is the yardstick, then the nine, then the same test run on last September’s managers.
How the tiers were scored
The rules were fixed before any manager was scored, and they use only results.
The window runs from each manager’s first competitive match to Sunday 20 September. It covers the Premier League, the Carabao Cup and the Champions League or Europa League where a club plays in them. The Community Shield and friendlies are excluded, and the FA Cup has not started. Every match counts the same, and the result is the one after 90 minutes; no tie has needed a shoot-out.
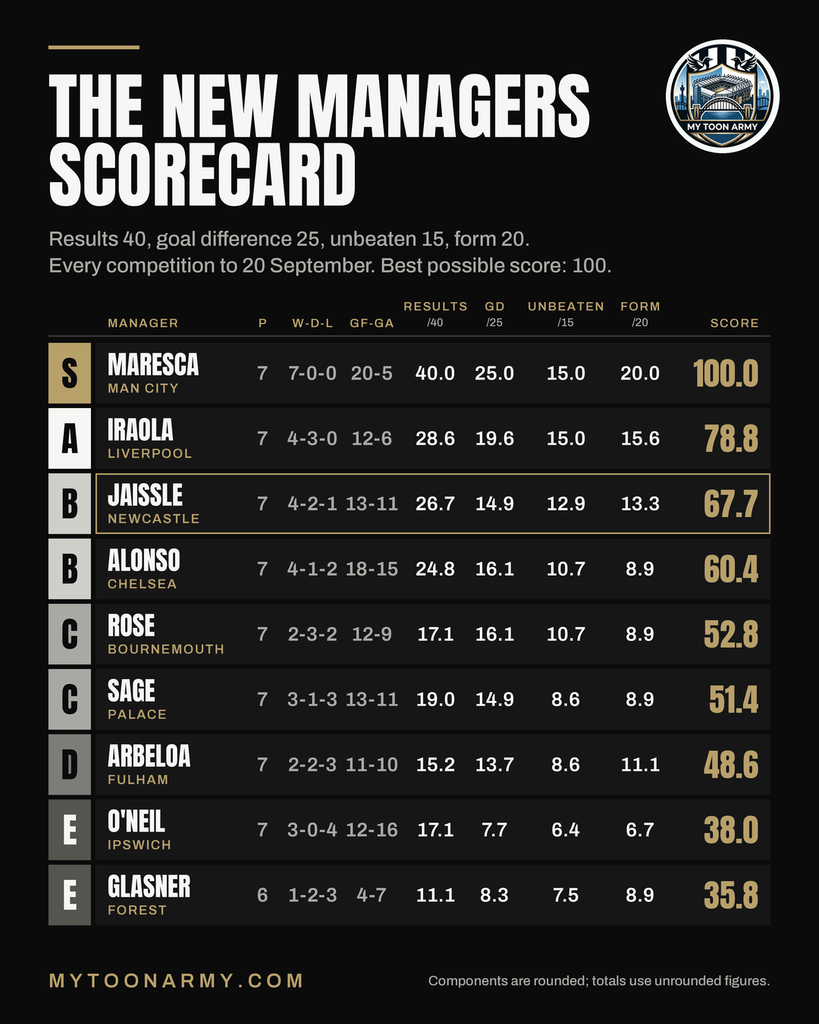
Four measures make a score out of 100:
Results (40 points): points per game across all competitions. Three per game earns the full 40.
Goal difference (25 points): goal difference per game, scaled so that +1.5 or better earns 25 and −1.5 or worse earns nothing.
Resilience (15 points): the share of matches not lost.
Form (20 points): points per game across the last three matches, scored like results.
Bands are S from 80, A from 70, B from 60, C from 50, D from 40, E from 30 and F below that.
Given the weights, nobody’s opinion touches the arithmetic. The weights themselves are a judgement, so we tested them, and three limits apply:
Six or seven games is a small sample.
A Carabao Cup tie against a League One side counts the same as a league match.
Nothing adjusts for opposition or uses expected goals.
We also tested the weights. Give the four measures equal weight and seven of the nine managers stay in the same tier; Liverpool (78.8) moves up to S and Fulham (48.6) up to C, each just short of a tier line. Count league games only and the bottom of the table reshuffles: Ipswich (1.2 points a game) and Forest (1.0) would rank fifth and sixth, above Palace, Bournemouth and Fulham. They sit at the bottom of the all-competition table because Palace, Bournemouth and Fulham have won all their cup and European games so far, while Ipswich and Forest went out of the Carabao Cup.
S: Enzo Maresca, Manchester City (100.0)
Seven wins have arrived in every shape. At Old Trafford, City played from the 23rd minute with ten men after Phil Foden was sent off, and still won 1-0 through Erling Haaland’s goal just before the hour. In Porto, Haaland scored twice, City’s expected goals came to 2.31 against the hosts’ 0.22, and Porto failed to register a shot on target. Against Norwich in the Carabao Cup, Maresca made ten changes and still won 5-0, with 17-year-old Floyd Samba scoring twice on his debut. Sunderland’s three goals on Sunday are the only crack so far.
SWOT.Strengths: a squad that survives rotation, and a striker who scored both goals in Porto. Weaknesses: the back line was stretched for the first time against Sunderland. Opportunities: a top-eight finish in the Champions League league phase gives an easier route. Threats: the calendar asks the hard questions early, with Liverpool away on 11 October, Aston Villa away on 24 October and Arsenal away on 28 November.
A: Andoni Iraola, Liverpool (78.8)
Iraola is unbeaten in seven, though only some of it has been comfortable. The league record is two wins and three draws, alongside a 2-1 Champions League win over Atlético Madrid and a 3-1 Carabao Cup win over Tottenham. Opta notes he is the first Liverpool manager unbeaten in his first five league games since Joe Fagan in 1983. Alexander Isak already has four league goals, more than in all of last season. The 1-0 at Bournemouth was scrappy: Jamie Carragher criticised the first half, and Liverpool gave the ball away too often in midfield.
SWOT.Strengths: three consecutive league clean sheets, and Jeremy Jacquet looking like a serious prospect beside Virgil van Dijk. Weaknesses: the attack has struggled for influence, and three of five league games were draws. Opportunities: a young defence that is still improving. Threats: Liverpool are sixth on nine points, with City at Anfield on 11 October.
B: Matthias Jaissle, Newcastle (67.7)
Newcastle’s start has had two faces. A 2-2 draw with Liverpool, a 2-0 win at Tottenham and a 2-2 draw with Bournemouth sat alongside a 3-2 Carabao Cup win over West Brom and a 1-0 win at Millwall. Then Leeds won 4-1 at Elland Road on a Monday night, a defeat Jaissle put down to a lack of intensity in duels and second balls. Saturday’s 2-1 win over Hull came with eight senior players absent, including Tino Livramento, and an 18-year-old, Sean Steur, in midfield. Joe Willock and Lewis Hall scored inside the first seven minutes, Yoane Wissa’s penalty was saved, and a late switch to a back three let Hull back in.
SWOT.Strengths: 13 goals in seven matches, and the direct, incisive football that Football365 saw in the Hull goals. Weaknesses: physical duels and second balls, in Jaissle’s own diagnosis. Opportunities: Newcastle are not in Europe, so they have clear midweeks to work with. Threats: Coventry away on Monday 12 October, Aston Villa at home on 17 October and Palace away on 25 October.
B: Xabi Alonso, Chelsea (60.4)
Chelsea began as entertainers: the first four league games produced 19 goals. They won 3-2 at Fulham and 4-3 against Brighton, lost 2-1 at Arsenal and drew 2-2 with Hull, with a 6-3 Carabao Cup win over Leeds and a 2-0 win over Luton in between. Then Brentford won 3-0. Chelsea have now conceded at least two goals in five straight league games under Alonso, conceded from set-pieces again and looked short of competitive mentality once behind. They have taken one point from their last three league games.
SWOT.Strengths: 18 goals in seven matches, with Cole Palmer and Morgan Rogers at the centre of it. Weaknesses: set-pieces, and shape once they concede. Opportunities: Moisés Caicedo’s return should add solidity in midfield. Threats: João Pedro’s knee injury, then Bournemouth at home on 10 October and Everton away on 17 October.
C: Marco Rose, Bournemouth (52.8)
Bournemouth’s league table and their season tell different stories. They have not won in five league games (three draws, two defeats), the ninth time in the club’s history they have failed to win any of their first five, and sit 17th. Yet they beat Lincoln 4-0 in the Carabao Cup and won 2-1 at Real Sociedad in their first European match, with Justin Kluivert scoring the club’s first European goal. Iraola’s return on Sunday ended in a 1-0 defeat, in a game between Iraola’s new side and Rose’s evolution of what Iraola built.
SWOT.Strengths: Bournemouth won plenty of second balls at Liverpool. Weaknesses: six goals in five league games, with two 2-2 draws among them. Opportunities: a Europa League campaign that has started with an away win. Threats: they are out of the bottom three only on tiebreakers, with Chelsea away on 10 October.
C: Pierre Sage, Crystal Palace (51.4)
Palace’s league form and Europe are a study in contrasts. They conceded 11 goals in their first four league games, four of them at home to City and three to Ipswich. Then they held Leeds 0-0 at Elland Road, and Tyrick Mitchell’s goal was ruled out for offside. In Europe Yéremy Pino, Chris Richards, Jørgen Strand Larsen from the penalty spot and Eddie Nketiah scored in a 4-0 Europa League win over Lech Poznań, and they won 3-0 against Middlesbrough in the Carabao Cup.
SWOT.Strengths: Adam Wharton driving the midfield, and depth up front with Mateta, Strand Larsen and Nketiah. Weaknesses: before the weekend, the worst defensive record in the league. Opportunities: the first clean sheet as a foundation, and Forest at home on 11 October. Threats: Palace are one point clear of the relegation zone.
D: Álvaro Arbeloa, Fulham (48.6)
Fulham have not won a league game, and only Tottenham are below them on goal difference. They lost 3-2 to Chelsea, 1-0 at Sunderland and 3-2 to Palace, then drew 0-0 at Liverpool and 1-1 with Manchester United. Against United the expected goals were 1.57 to 1.59. The cups have been kinder: a 3-0 win over AFC Wimbledon after ten changes was his first competitive win, followed by a 3-2 win at West Ham.
SWOT.Strengths: a young, revamped side that is scrapping hard, with back-to-back draws against Liverpool and United. Weaknesses: eight goals conceded in five league games. Opportunities: Ipswich on 10 October, then Hull and Coventry. Threats: only Tottenham are below them on goal difference.
E: Gary O’Neil, Ipswich (38.0)
Ipswich won their opener 2-1 against Sunderland, won 3-2 at Palace and beat Leicester 3-1 in the Carabao Cup. But they conceded five at Old Trafford, lost 4-2 to Arsenal in the Carabao Cup, where 16-year-old Max Dowman scored twice, and lost 1-0 at Everton, where they finished with ten men. Ipswich have gone 24 Premier League games without a clean sheet, their worst run in the top flight, and O’Neil has now lost 50 of his 93 Premier League games as a manager.
SWOT.Strengths: goals on the road, including three at Palace. Weaknesses: defending, without a clean sheet in 24 top-flight games. Opportunities: Fulham at home on 10 October, a match the pre-match model rates as close to even. Threats: Manchester City away on 17 October, then Forest at home on 23 October, a meeting of the two E-tier sides.
E: Oliver Glasner, Nottingham Forest (35.8)
Forest have played six and won one. Leeds beat them twice in four days, 1-0 in the league and 2-0 in the Carabao Cup. Draws with Liverpool (2-2) and Tottenham (0-0) followed, then a 2-1 win at Villa. On Saturday Coventry won 1-0 at the City Ground, their first Premier League win in 25 years, after VAR ruled out a late equaliser by Igor Jesus. Forest have not scored in any of three home league games. Glasner’s own diagnosis was psychological, not tactical.
SWOT.Strengths: points against Liverpool and Tottenham, and a win at Villa. Weaknesses: home scoring, and the loss of Elliot Anderson. Opportunities: Liam Delap, who arrived from Chelsea, and Palace away on 11 October. Threats: the club’s fifth manager in 12 months, with Arsenal at the City Ground on 18 October.
Then and now: are the clubs better off?
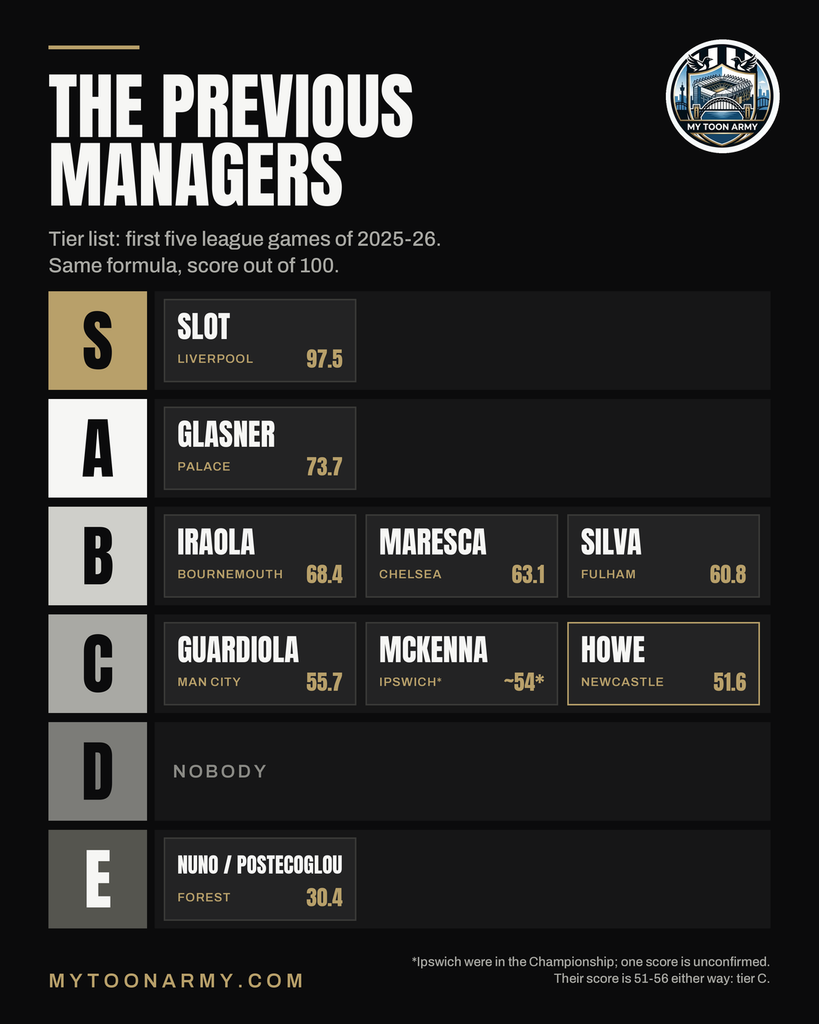
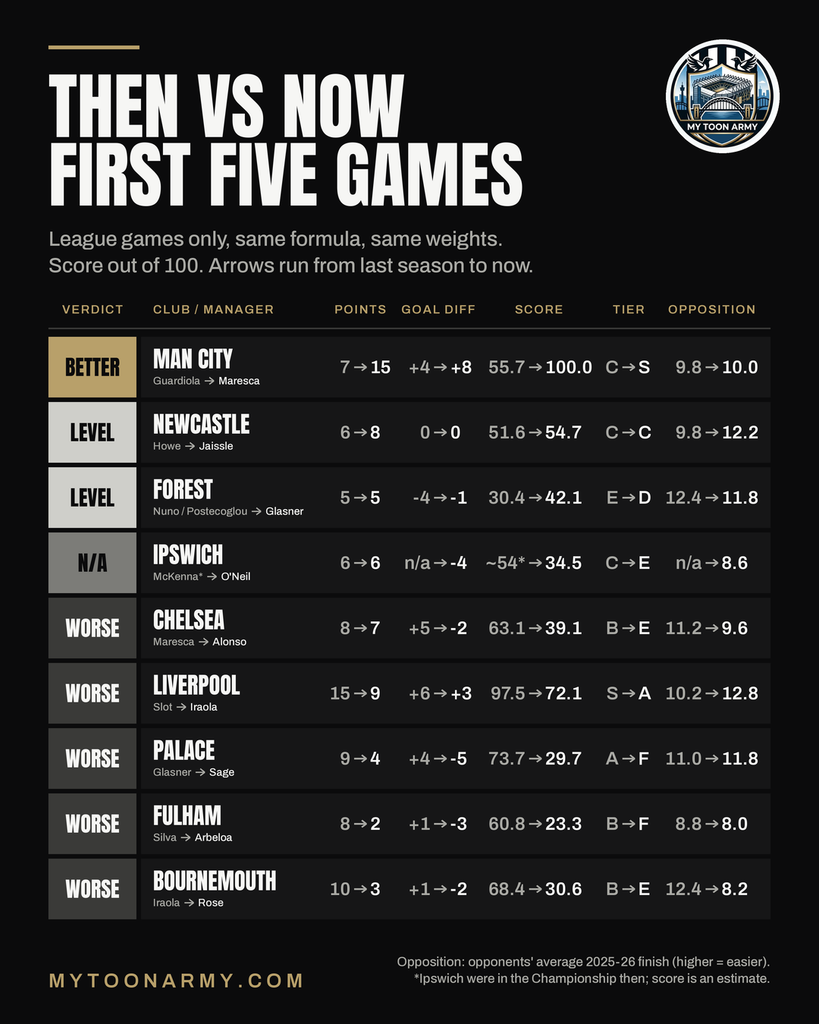
Put last September beside this one and the change looks less like renewal than a bill. Across the eight clubs that were also in the Premier League a year ago, the first five league games returned 68 points under the managers who left and 53 under the men who replaced them. Only two of the eight are ahead on points, and one of those is ahead by two.
To keep the comparison as close to like-for-like as the data allows, everything is held constant. Each club gets the same window, its first five league games, and the same four-part formula with the same weights. Cup and European matches are left out on both sides, so the tiers below will not match the all-competition tiers earlier in this piece: Palace and Bournemouth, whose Europa League and Carabao Cup wins no longer count, fall several places. “Then” means the man actually in the dugout for those five games last season: Guardiola at City, Slot at Liverpool, Howe at Newcastle, Maresca at Chelsea, Iraola at Bournemouth, Glasner at Palace and Silva at Fulham, and at Forest Nuno for three matches and Postecoglou for two. Ipswich were in the Championship, so their row carries a warning: it is a different division, and the score of one of their five matches is missing from our record. Their tier is C for any defeat of up to four goals.
Fixtures are the obvious objection, so we tested them. Ranking every opponent by where it finished in 2025-26, with newly promoted clubs counted as 19th, the average opponent this September was easier than last year’s for Liverpool (12.8 against 10.2) and for Newcastle (12.2 against 9.8). It was harder for Bournemouth (8.2 against 12.4), whose five games included Manchester City, Liverpool and Newcastle, and for Chelsea (9.6 against 11.2). For the other four clubs the swing is less than a single place.
Manchester City are the only clear improvement. Points are up from seven to fifteen and goal difference from +4 to +8, against opposition of almost identical difficulty. Guardiola’s side lost at home to Tottenham and at Brighton within nine days; Maresca’s has beaten every opponent, including a 1-0 win at Old Trafford played with ten men. His own record is the sharper comparison: eight points from Chelsea’s first five games last season, fifteen from City’s now.
Newcastle are level, with the fixtures helping. Six points became eight, but goal difference is zero in both years and the opposition was two and a half places easier this time. Howe’s five contained three goalless draws and a 3-2 home defeat to Liverpool; Jaissle’s contain a 4-1 defeat at Leeds and wins at Tottenham and against Hull. Newcastle scored and conceded three goals then and nine now. On equal weights the score barely moves, from 56.4 to 56.9: a club in the same place, with more goals at both ends.
Forest have moved sideways. Five points then and five now, with goal difference improved from −4 to −1 against a marginally harder run. Nuno’s side lost 3-0 at home to West Ham and Postecoglou’s lost 3-0 at Arsenal; Glasner’s has drawn at Liverpool, drawn with Tottenham and won at Villa. The trouble is at home, where the league goals have not come.
Five clubs are worse. Liverpool fell from fifteen points to nine despite the easier schedule, though an unbeaten start of two wins and three draws is a better place than the fall suggests. Chelsea’s points barely moved, eight to seven, but goal difference went from +5 to −2 against a harder run, and they have conceded at least twice in each of their five league games. Bournemouth’s drop is the biggest in points, ten to three, and the fixture list explains part of it. Palace (nine points to four) and Fulham (eight to two) faced almost the same difficulty as a year ago, and neither has that defence.
The men, not only the badges. Follow the managers instead of the clubs and the picture is mixed. Maresca went from eight points to fifteen, Iraola from ten to nine, Glasner from nine to five. That suggests squads and starting points matter at least as much as the man in charge, though three managers is a thin sample.
The verdict. One club is clearly better, two are level, one cannot be compared and five are worse, on the same five games and the same formula. The direction holds when the weights are equalised: all eight comparable clubs move the way they did before, and only Newcastle by less than a point. It mostly holds when fixtures are considered; the exceptions are Newcastle, whose small gain leans on an easier run, and Bournemouth, whose fall is partly the fixture list. Two cautions apply. Five games is a snapshot, not a forecast: Liverpool won their first five last season and led the table until 4 October, then finished fifth. And none of this says the appointments were mistakes. It says the change has not yet bought improvement at seven of the eight comparable clubs.
What it means for Newcastle. The results above cover the soft part of the fixture list. Newcastle’s first five league opponents averaged 12.2 on the same yardstick, and the next five, Coventry, Aston Villa, Palace, Everton and Fulham, average 12.4, so by 7 November they will have played ten games against opposition easier than the league average. Then come four league games in a fortnight against Arsenal, Brighton, Manchester United and Sunderland, all of whom finished in last season’s top eight. On the current dates, that run from 21 November to 5 December is where a start that reads as level becomes better or worse.
What the international break decides
The scorecard reopens quickly. Ipswich host Fulham and Chelsea host Bournemouth on 10 October. Palace host Forest and Liverpool host City on 11 October, then Newcastle visit Coventry on Monday 12 October. Forest’s trip to Selhurst Park has the sharpest edge: Oliver Glasner returns to the club he left, to face Pierre Sage, the man who replaced him.
How has your team performed so far with the new manager? Newcastle fans, are you satisfied with Jaissle’s return of points in the first stanza of the season just concluded? Join the conversation on X @mytoonarmy #NUFC
Results are to Sunday 20 September 2026. Match results come from Sportradar data and broadcaster match reports; context and statistics are drawn from Sky Sports, ESPN, Opta Analyst, UEFA.com, Football365, BBC Sport and AFP.